
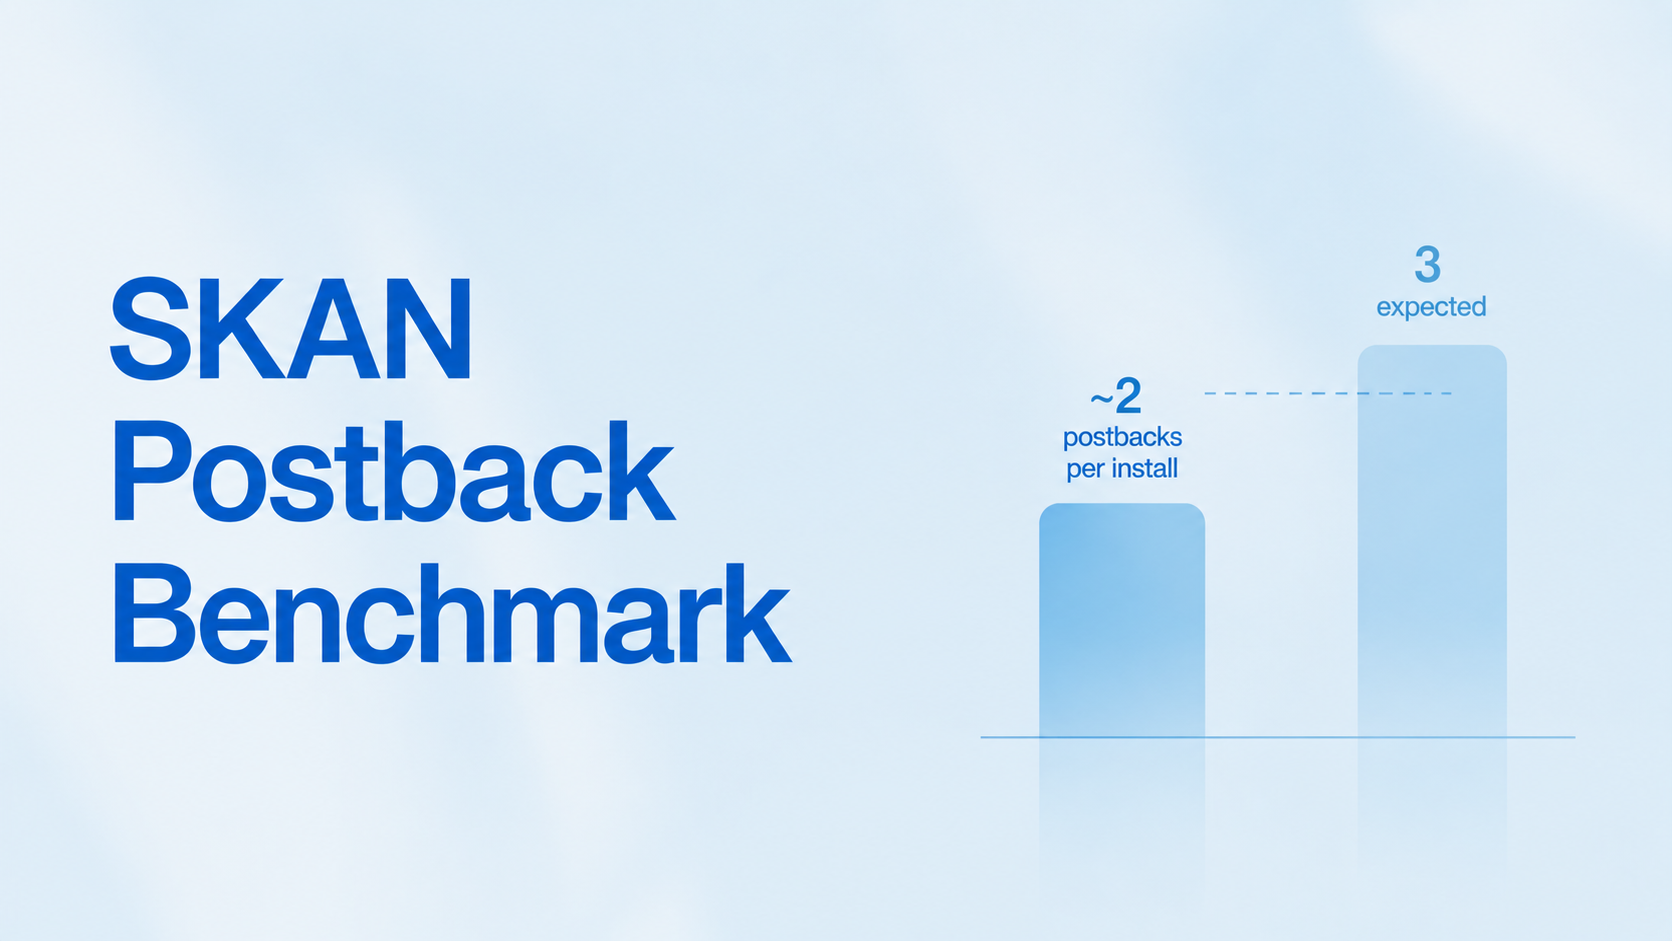
Across around 50k iOS installs and roughly 100k SKAN postbacks processed on Linkrunner in the 30 days ending 25 May 2026, the average iOS app received about two postbacks per install, not three. That single ratio quietly contradicts the way most growth teams describe SKAN 4.0 in planning meetings and budget reviews.
The three-postback envelope is a ceiling, not a delivery promise. The roughly one-third gap between the ceiling and the observed ratio is where most of the real iOS measurement work sits in 2026. This post lays out the benchmark, explains where the missing postbacks go, and shows how to read postback intensity in your own MMP without overstating what SKAN can actually tell you.
What SKAN Postback Intensity Actually Measures (And What It Does Not)
A SKAN postback is the privacy-preserving conversion notification that Apple's SKAdNetwork framework sends from a user's device to an ad network and its measurement partner, summarising in-app activity inside a fixed time window without revealing the user's identity.
Postback intensity is a different question from coverage. It measures how many SKAN postbacks arrive per iOS install in a window, not the share of iOS installs that received at least one postback. The two are often confused.
- The intensity ratio is publicly defensible because both numerators (postbacks) and denominators (iOS installs) are aggregate counts.
- A per-install coverage rate is not publicly derivable, because Apple does not link an individual postback back to a specific install record in any MMP. The signature is keyed on the ad network and the source app, not on the install identifier.
- Reading "postbacks per install" is the only defensible cut to compare to a benchmark.
The three-postback envelope in SKAN 4.0 is the ceiling for any single install. It is not a delivery guarantee. If a user does not produce a qualifying conversion value update in the second or third window, the second or third postback never gets sent. Read more on how SKAN, fingerprinting, and probabilistic methods fit together in our guide on tracking user journeys in a post-IDFA world.
The Linkrunner Benchmark: About Two Postbacks per iOS Install Across Roughly 20 Apps
The headline figure for 2026 is roughly two SKAN postbacks per iOS install.
Methodology: 30-day window ending 25 May 2026. Around 50k iOS installs processed on Linkrunner. About 100k SKAN postbacks received across roughly 20 iOS-active apps. Aggregate counts only, no project-level disclosure. Query reference held in Linkrunner's approved DB-insight category library.
The benchmark sits roughly a third below the theoretical SKAN 4.0 ceiling of three postbacks per install. That gap is the part of the picture most planning frameworks gloss over.
What the gap actually contains:
- LAT users. Limit Ad Tracking users still register installs, but ad networks do not always receive a postback that can be tied back through the SKAdNetwork attribution chain.
- Redownloads with no fresh ad touch. A user who reinstalls without a new qualifying ad click does not trigger a fresh postback cycle.
- Postbacks Apple did not deliver. Network failures, ad-network endpoint changes, and signature validation rejections all eat into the count.
- Postbacks beyond the measurement window. Some second and third postbacks fall outside the 30-day window the install count was pulled from, so the denominator captures the install but not its tail postbacks.
Why the Number Is Not Three (And What Eats the Difference)
The SKAN 4.0 three-postback structure is conditional, not automatic. Each postback after the first is gated on user activity inside its own window.
- Postback 1: triggered between 0 and 2 days after install if the conversion value condition is met.
- Postback 2: triggered between 3 and 7 days if a fresh conversion value update is locked in inside that window.
- Postback 3: triggered between 8 and 35 days if a further qualifying update happens.
If the second window passes without a qualifying update, the second postback does not fire. The third is then impossible. For most apps, the user behaviour curve drops off sharply after day three, so postback two and postback three are the ones that go missing first.
Apple's own documentation on receiving SKAN postbacks describes the conditional cadence in detail; see Apple's Receiving postbacks in multiple conversion windows page for the spec.
Ad networks also vary in how aggressively they request postbacks and how they handle signature mismatches. Our strategic SKAN 4.0 decoding framework walks through how to read postback timing, anonymity thresholds, and conversion value schemas in a way that survives this conditionality.
What This Benchmark Means for Your iOS Strategy
A roughly-two ratio has practical implications for how you spend iOS measurement time and budget.
- Stop assuming every iOS install will generate three postbacks. Your conversion value model should treat postback two and postback three as the rarest signal. Design the most decision-critical updates for the first window, not the third.
- The second and third postbacks carry the rarest signal precisely because they are gated. A signup or shallow event is far more likely to survive into postback one than a paid conversion is to survive into postback three. Map your highest-value events to the first window where possible.
- Right-size your iOS measurement engineering against your iOS share. Across the Linkrunner customer base, iOS makes up a small share of total install volume in India. If iOS is under around 5 per cent of your installs, the engineering hours spent perfecting a fine-grained conversion value schema for postback three need to be justified against the cohort that will produce it.
- Vertical-specific calibration matters. A subscription app converting in days behaves differently from an eCommerce app converting in hours. Our guide on SKAN 4.0 configuration strategies for different app types covers the per-vertical schema choices.
Diagnosing Postback Intensity in Your Own MMP
The cut to pull is small and easy to run weekly.
- Pull SKAN postback count for the last 30 days.
- Pull iOS install count for the same 30 days.
- Divide. Compare to a benchmark of around two postbacks per install.
How to read the result:
- Ratio close to two: in line with the wider Linkrunner customer base in 2026.
- Ratio meaningfully below one: investigate SKAN registration in the SDK, postback URL configuration with each ad network, and conversion value mapping. A low ratio frequently traces back to a single misconfigured network rather than an SDK problem.
- Ratio meaningfully above three: investigate duplicate postback receivers, webhook double-fire on your side, and possible double-counting from networks that retry signatures.
A single number gives you a tripwire. Pair it with a per-network breakdown when something looks off.
What to Configure Differently if Your Ratio Looks Off
If the weekly cut shows drift, work in this order.
- Conversion value mapping audit. Confirm the values fired by the SDK match the values the ad networks expect. Stale mappings from an earlier app version are a common silent failure.
- Postback URL audit across Meta, Google, TikTok, and Snapchat. Each network has its own SKAN postback endpoint. A single missing endpoint can drop your ratio noticeably. Our complete postback setup guide for Meta, Google, and TikTok covers the per-network configuration steps.
- Privacy tier review. Apple's privacy tiers control how much detail leaves the device. A misconfigured tier setting can suppress postback content even when delivery is technically working.
Tools like Linkrunner let you pull the SKAN postback count and the iOS install count from the same dashboard, rather than reconciling SKAN postback exports against MMP install reports in a spreadsheet. The cleanup saves a recurring hour a week on iOS-heavy apps.
FAQ
How many SKAN postbacks should a normal iOS app receive per install in 2026?
Across roughly 20 iOS-active apps on Linkrunner in the 30 days ending 25 May 2026, the wider customer base averaged about two postbacks per install. The three-postback ceiling is a theoretical maximum, not a typical outcome.
Why is the observed ratio lower than the SKAN 4.0 three-postback ceiling?
The second and third postbacks are conditional on qualifying conversion value updates inside fixed windows. Many users do not produce qualifying activity in windows two and three, so those postbacks are never sent. LAT users, redownloads without new ad touches, and delivery failures account for the rest of the gap.
What does it mean if my SKAN postback count is well below this benchmark?
A ratio well under one postback per install usually indicates SKAN registration, postback URL, or conversion value mapping issues with at least one ad network. Audit the network configuration before assuming the SDK is at fault.
Do SKAN postbacks include reattribution events?
SKAN postbacks are tied to the SKAdNetwork attribution chain initiated by a qualifying ad click. Reattribution to an existing user via a fresh ad touch can trigger a new SKAdNetwork campaign and therefore a new postback chain. Reattribution tracked through MMP-side flags is a separate measurement layer.
Should I optimise my conversion values for postback 1, postback 2, or postback 3?
Treat postback 1 as the most reliable signal carrier and design your highest-priority events to fit inside the 0 to 2 day window where possible. Postbacks 2 and 3 should carry the more delayed value events, with the understanding that a meaningful share of installs will never produce them.
Where to Go From Here
If you are running iOS UA in 2026, postback intensity is the single weekly cut that protects you from drifting into invalid SKAN reporting. Run the ratio, compare it to a benchmark of around two postbacks per install, and act on anything well under one or well above three before you change channel mix or budget assumptions.
If you want a single dashboard that pulls postback count and iOS install count side by side, request a Linkrunner demo and we will walk through the cut on your own data. Pair it with the weekly attribution audit checklist already in your workflow, and you have a SKAN hygiene loop that runs in under fifteen minutes a week.