Your MMP dashboard shows 25,000 installs last month at ₹85 CPI. Meta claims 24,200 installs. Google reports 26,100. When you try to understand which campaigns drove users who actually completed onboarding, made purchases, or stayed active for 30 days, you're suddenly switching between four different tools and a spreadsheet. The data exists somewhere, but connecting attribution to product behaviour to revenue to engagement requires manual exports, SQL queries, and hours of reconciliation work that should have been automated months ago.
This is the analytics gap that separates teams who make data-driven decisions daily from those who wait weeks for custom reports. Your MMP provides attribution (which marketing touchpoint drove each install), but attribution alone doesn't tell you what users did after installing, why they churned, how to re-engage them, or which product features correlate with revenue.
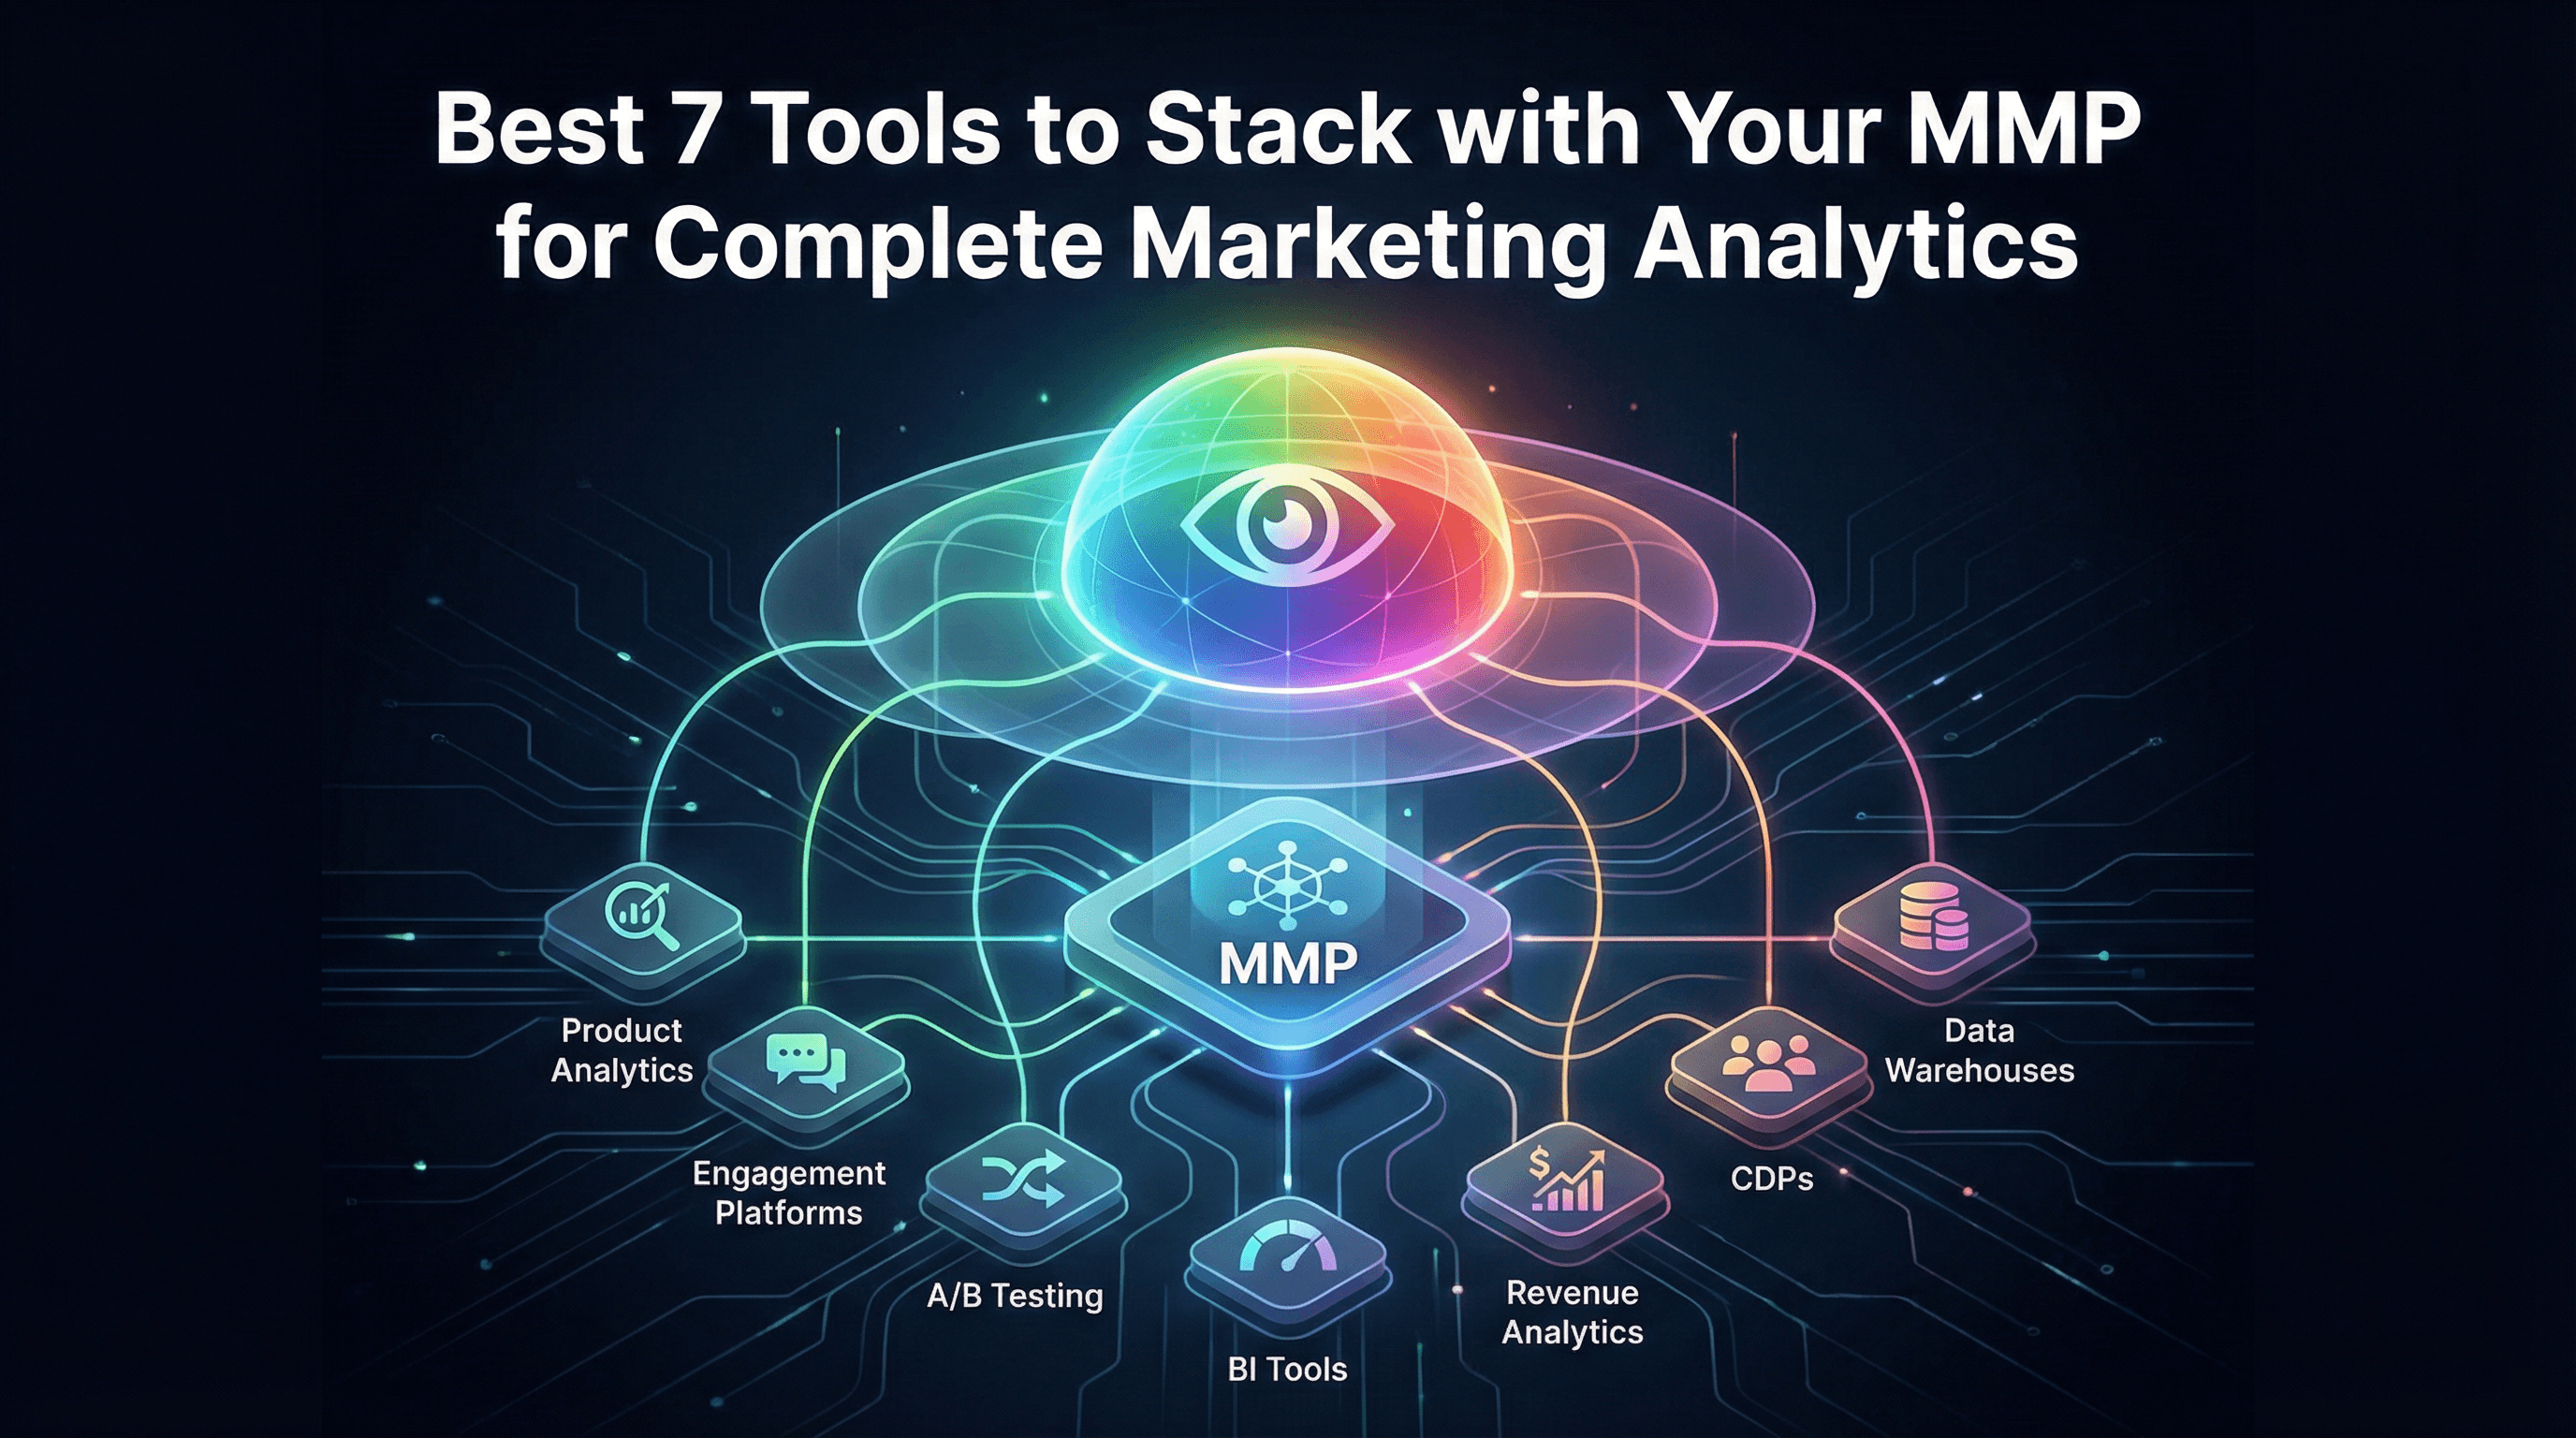
The most effective mobile marketing stacks combine MMPs with complementary tools that handle product analytics, engagement automation, experimentation, and revenue intelligence. Each tool serves a distinct purpose, and when integrated properly, they create a unified view of the user journey from first ad click through long-term monetisation.
Why MMP Alone Isn't Enough: The Analytics Gap
MMPs excel at answering attribution questions. Which campaign drove this install? What's the CAC by channel? How many conversions did we send back to Meta? These are critical questions, but they represent only the first stage of understanding your mobile business.
Once a user installs, you need different tools to answer different questions. Why did 60% of users abandon onboarding at step three? Which cohort of users has the highest 90-day retention? What's the optimal time to send a re-engagement push notification? How does feature usage correlate with subscription conversion?
Your MMP captures install attribution and basic in-app events, but it wasn't designed to be a product analytics platform, an engagement automation system, or a data warehouse. Teams that try to force their MMP to handle everything end up with incomplete views and manual workarounds.
The goal isn't to replace your MMP. The goal is to build a stack where each tool handles what it does best, with clean data flows between systems. Your MMP should feed attribution data into your product analytics tool, which informs your engagement platform, which triggers campaigns that get tracked back in your MMP. This creates a closed loop where marketing, product, and growth teams work from the same unified dataset.
Tool #1: Product Analytics (Mixpanel/Amplitude) for In-App Behaviour
Product analytics platforms track detailed user behaviour inside your app: which screens they visit, which buttons they click, how long sessions last, where users drop off in funnels, and how feature usage evolves over time.
Your MMP tells you a user installed via a Meta ad. Mixpanel or Amplitude tells you that same user completed onboarding, activated three features in their first session, returned five times in week one, and made their first purchase on day eight. This behavioural data is what product and growth teams need to optimise activation, retention, and monetisation.
These platforms excel at cohort analysis, funnel visualisation, and retention curves segmented by user properties. You can build reports showing that users who activate feature X have 3x higher 30-day retention than those who don't, or that users acquired from organic search have 40% higher LTV than paid social users.
Integration with your MMP is critical. When you import attribution data (campaign, channel, creative) into your product analytics tool as user properties, you can segment all behavioural analysis by acquisition source. This lets you answer questions like "do users from Meta ads engage differently than users from Google ads?" or "which campaigns drive users who actually complete purchases?"
Pricing typically ranges from free tiers (up to 20 million events monthly for Amplitude, 100,000 users monthly for Mixpanel) to ₹50,000-₹2,00,000 monthly for growing apps with millions of events. Implementation requires installing an SDK and defining your event taxonomy carefully.
Tool #2: Engagement Platform (MoEngage/CleverTap) for Lifecycle Messaging
Engagement platforms orchestrate push notifications, in-app messages, email campaigns, and SMS based on user behaviour and lifecycle stage. They're designed to automate personalised communication at scale.
Your MMP and product analytics tools tell you who your users are and what they're doing. Engagement platforms act on that data by triggering messages: welcome sequences for new users, re-engagement campaigns for dormant users, upsell messages for active users, and win-back offers for churned users.
These tools typically include journey builders (visual workflow editors), segmentation engines (define user groups based on behaviour and attributes), and A/B testing for messaging optimisation. Advanced platforms also offer predictive features like churn prediction and send-time optimisation.
The integration flow works like this: your MMP attributes an install to a specific campaign and sends that data to your engagement platform. Your product analytics tool tracks that user's behaviour and updates their profile. Your engagement platform uses both attribution and behavioural data to determine which messages to send. When users click those messages and return to the app, the cycle continues.
For example, you might create a segment of "users acquired via Meta ads in the last 7 days who haven't completed their first purchase" and send them a targeted discount offer via push notification. The attribution context (Meta ads) combined with behavioural context (no purchase) enables precise targeting that generic blast campaigns can't match.
Pricing ranges from ₹40,000-₹3,00,000 monthly depending on user volume, channels used, and feature access. Implementation involves SDK integration and connecting data sources from your MMP and analytics tools.
Tool #3: A/B Testing Tool (Statsig/Optimizely) for Experiment Tracking
Experimentation platforms let you run controlled tests on app features, pricing, onboarding flows, and UI changes to understand causal impact on key metrics before rolling out changes to all users.
Your MMP and analytics tools show correlation (users who do X have higher retention), but experimentation shows causation (changing X causes retention to increase). This distinction matters when making product decisions that affect millions of users.
Modern experimentation platforms handle experiment design, traffic allocation, statistical analysis, and results reporting. They integrate with your MMP to ensure attribution data is available as experiment dimensions, letting you analyse how experiments affect paid versus organic users differently.
For mobile growth teams, common experiments include onboarding variations (does reducing steps from 5 to 3 improve activation?), pricing tests (does ₹99 monthly convert better than ₹999 annually?), and feature rollouts (does adding social sharing increase viral coefficient?).
Integration with attribution data is crucial. You might discover that an onboarding experiment improves conversion for organic users but hurts conversion for paid users because their expectations differ based on the ads they clicked. Without attribution context, you'd miss this nuance.
Pricing varies dramatically. Statsig offers generous free tiers suitable for startups. Optimizely and similar enterprise platforms cost ₹1,00,000-₹5,00,000+ monthly. Implementation requires SDK integration and coordination with product and engineering teams.
Tool #4: Business Intelligence (Metabase/Looker) for Custom Dashboards
BI tools connect to your data warehouse and let you build custom dashboards, reports, and SQL-based analysis that combines data from multiple sources: your MMP, product analytics, engagement platform, payment processor, and customer support system.
Out-of-the-box dashboards from individual tools serve their specific purposes, but executive teams and cross-functional projects often need custom views that blend data sources. Your CFO wants to see marketing spend, attributed installs, activation rates, and revenue all in one dashboard. Your BI tool makes this possible.
BI platforms query your data warehouse (which aggregates data from all your tools) and present results through dashboards, scheduled reports, and embedded analytics. Non-technical stakeholders can explore data through visual interfaces while analysts can write custom SQL for complex analysis.
Common use cases include executive reporting (weekly performance summaries combining attribution, engagement, and revenue), cohort economics (LTV calculations that join MMP attribution with payment processor revenue), and channel performance analysis (combining ad spend from multiple platforms with MMP attribution data).
Pricing ranges from free (Metabase self-hosted) to ₹50,000-₹3,00,000 monthly (Looker, Mode, Tableau) depending on user seats and data volume. Implementation requires setting up a data warehouse first and configuring data pipelines from your various tools.
Tool #5: Revenue Analytics (Baremetrics/ChartMogul) for Subscription Metrics
Revenue analytics platforms are purpose-built for subscription businesses, calculating metrics like MRR, churn rate, LTV, and cohort revenue that standard analytics tools struggle with.
If you run a subscription app (SaaS, streaming, productivity, fitness), your revenue model has complexity that generic analytics tools don't handle well. Subscription upgrades, downgrades, pauses, and cancellations create calculation challenges. Revenue analytics platforms solve this by connecting directly to payment processors (Stripe, RevenueCat, Chargebee) and handling subscription logic automatically.
These tools calculate metrics like MRR (monthly recurring revenue), ARR (annual recurring revenue), churn rate, expansion revenue, and cohorted LTV. They show which acquisition channels drive highest-value subscribers and how long it takes different cohorts to pay back their acquisition cost.
Integration with your MMP adds attribution context to revenue analysis. You can answer questions like "what's the average LTV of users acquired via Google UAC versus Meta ads?" or "do users acquired with promo codes have higher or lower churn rates than full-price users?"
Pricing typically ranges from ₹15,000-₹1,00,000 monthly based on MRR volume. Implementation connects your payment processor, and optionally imports attribution data from your MMP for segmented analysis.
Tool #6: Customer Data Platform (Segment/RudderStack) for Data Routing
Customer Data Platforms (CDPs) act as central hubs that collect data from all sources, clean and standardise it, and route it to all destinations. Instead of building point-to-point integrations between every tool, you send data to your CDP once and configure destinations through a visual interface.
Without a CDP, integrating five tools requires potentially 20 separate connections (each tool sending and receiving data from every other tool). With a CDP, you implement one SDK that sends data to the CDP, then configure destinations in the CDP dashboard. This dramatically reduces engineering work and makes adding new tools trivial.
CDPs also enforce data governance by standardising event schemas, validating data quality, and managing user privacy preferences across all downstream tools. When a user requests data deletion, you handle it once in the CDP rather than individually in every connected tool.
For mobile growth stacks, CDPs ensure your MMP, product analytics, engagement platform, and data warehouse all receive the same clean event data. This eliminates discrepancies caused by different SDKs tracking differently.
Pricing varies. RudderStack offers open-source self-hosted options plus cloud plans starting around ₹30,000 monthly. Segment charges based on event volume, typically ₹50,000-₹3,00,000 monthly for growing apps. Implementation requires replacing individual tool SDKs with the CDP SDK and configuring destinations.
Tool #7: Data Warehouse (BigQuery/Redshift) for Custom Analysis
Data warehouses store all your raw event data in a structured format that supports SQL queries, enabling custom analysis that individual tool dashboards can't provide.
Every tool in your stack (MMP, product analytics, engagement platform) stores data in their own databases optimised for their specific use cases. When you need to join data across tools or run analysis that no single tool supports, you need a data warehouse.
Warehouses aggregate data from all sources (via API exports, webhooks, or CDP connections) into a unified schema. This lets you write SQL queries that join attribution data from your MMP with behavioural data from your analytics platform with revenue data from your payment processor.
Common use cases include custom cohort analysis (calculating metrics no pre-built tool provides), regulatory reporting (GDPR data requests requiring exports across all systems), and ML model training (building predictive models using complete user histories).
BigQuery and Redshift both offer usage-based pricing that starts small and scales with data volume. Small apps might spend ₹5,000-₹15,000 monthly on warehouse costs. Larger apps spending ₹50,000-₹2,00,000 monthly usually have significant data volumes and complex analysis needs. Implementation requires setting up ETL pipelines to move data from your tools into the warehouse.
Integration Strategy: What Data Flows Where
The most effective stacks follow a hub-and-spoke model. Your data warehouse sits at the centre, receiving data from all tools and making it available for custom analysis. Each specialised tool (MMP, product analytics, engagement) handles its core function and shares data bidirectionally.
A typical data flow looks like this:
User clicks ad → MMP tracks click
User installs app → MMP attributes install to campaign
User behaviours tracked by product analytics SDK
Attribution data flows from MMP to product analytics and engagement platform
Engagement platform sends targeted messages based on attribution and behaviour
All raw data flows to data warehouse for custom analysis
BI tool queries warehouse to create executive dashboards
Modern MMPs like Linkrunner simplify this by providing native integrations with major product analytics platforms (Mixpanel, Amplitude), engagement tools (MoEngage, CleverTap), and data warehouses (BigQuery). This eliminates custom integration work and ensures attribution data is available wherever your team needs it.
Cost Reality: What This Stack Actually Costs
A complete marketing analytics stack costs between ₹50,000 and ₹5,00,000 monthly depending on scale and tool choices.
Minimal stack (early-stage apps, under 50,000 MAU): ₹50,000-₹1,50,000 monthly
MMP: ₹40,000 (Linkrunner at ₹0.80/install for 50,000 installs)
Product Analytics: Free tier (Amplitude or Mixpanel)
Engagement Platform: ₹40,000-₹80,000 (MoEngage or CleverTap basic)
Data Warehouse: ₹5,000-₹15,000 (BigQuery usage-based)
Growth stack (scaling apps, 100,000-500,000 MAU): ₹2,00,000-₹4,00,000 monthly
MMP: ₹80,000-₹1,60,000
Product Analytics: ₹80,000-₹1,50,000
Engagement Platform: ₹1,00,000-₹2,00,000
A/B Testing: ₹30,000-₹60,000
BI Tool: ₹20,000-₹40,000
Data Warehouse: ₹15,000-₹30,000
Enterprise stack (mature apps, 1M+ MAU): ₹5,00,000+ monthly
Includes all tools at scale pricing with dedicated support and custom SLAs.
Tool costs scale with usage, but the biggest hidden cost is integration and maintenance. Building custom integrations, managing data quality, and training teams on multiple platforms requires ongoing engineering and analytics resources.
Minimal Viable Stack for Growing Apps
If you're just starting to build beyond basic attribution, prioritise these three tools:
MMP + Product Analytics + Engagement Platform. This combination gives you attribution (where users come from), behaviour (what users do), and activation (how to engage users). You can layer in BI tools, CDPs, and data warehouses later as complexity grows.
Choose tools with strong native integrations to minimise engineering overhead. Platforms like Linkrunner that integrate directly with Mixpanel, Amplitude, MoEngage, and CleverTap let you connect attribution data to downstream tools without building custom pipelines.
Start with vendor-provided dashboards and pre-built reports. Only invest in custom data warehousing and BI tools once you've exhausted what native integrations can provide.
Request a demo from Linkrunner to see how unified attribution at ₹0.80 per install integrates with your product analytics and engagement tools, creating a complete view of your user journey without the complexity of enterprise MMP pricing or fragmented tool stacks.
Frequently Asked Questions
Do I need all seven tools from day one?
No. Start with an MMP (attribution), product analytics (behaviour), and optionally an engagement platform (messaging). Layer in additional tools as specific needs arise. Most apps operate effectively with just 3-4 core tools plus a lightweight BI solution.
How do I know if my current tool stack has gaps?
Ask whether you can answer these questions easily: Which campaigns drive highest-quality users? What do users do after installing? How do we re-engage churned users? If answering requires manual exports and hours of spreadsheet work, you have integration gaps that additional tools could solve.
What's the biggest integration mistake teams make?
Sending inconsistent data to different tools. If your MMP tracks an event as "purchase_completed" but your product analytics tool calls it "checkout_success", you can't join data across systems. Establish a unified event taxonomy and enforce it across all tools from day one.
Should I use a CDP or can I integrate tools directly?
For teams with 3-5 tools, direct integrations work fine and reduce complexity. Once you exceed 5 tools or need strict data governance (GDPR compliance, data quality validation), a CDP becomes worthwhile. The engineering effort to maintain direct integrations eventually exceeds CDP costs.
How do I convince finance to approve multiple tool costs?
Frame it as infrastructure investment, not expense. Calculate the cost of making poor marketing decisions due to incomplete data versus the cost of tools that provide complete visibility. A ₹2,00,000 monthly tool stack that improves marketing efficiency by 20% pays for itself when you're spending ₹20 lakh monthly on user acquisition.
Can Linkrunner replace other tools in this stack?
Linkrunner handles attribution and basic event tracking, making it a replacement for legacy MMPs. It integrates with (rather than replaces) product analytics, engagement platforms, and data warehouses. The goal is unified data, not tool consolidation that sacrifices specialisation.