You're driving 90,000 monthly app installs across Meta, Google, and influencer campaigns, spending ₹70 lakh on acquisition. Your dashboard shows healthy D1 retention at 38% and strong session frequency. But when you calculate purchase conversion, the reality hits: only 4.2% of installs result in first purchases, and your blended CAC of ₹780 per install translates to ₹18,570 per paying customer, making acquisition economics completely unsustainable.
Here's what's broken: you're measuring app engagement (opens, sessions, product views) without understanding purchase intent or channel attribution. A user who browses 20 products across five sessions but never adds anything to cart isn't "engaged," they're window shopping. Meanwhile, users arriving via QR codes from offline stores, or referred by Instagram influencers, follow completely different purchase paths than paid ad users, but your attribution treats them identically.
D2C brand apps face unique measurement challenges that generic eCommerce playbooks ignore. Omnichannel customer journeys (offline stores, QR codes, social media, web-to-app), strong brand loyalty programs, and subscription models require specialised tracking that connects online and offline touchpoints while measuring true customer lifetime value.
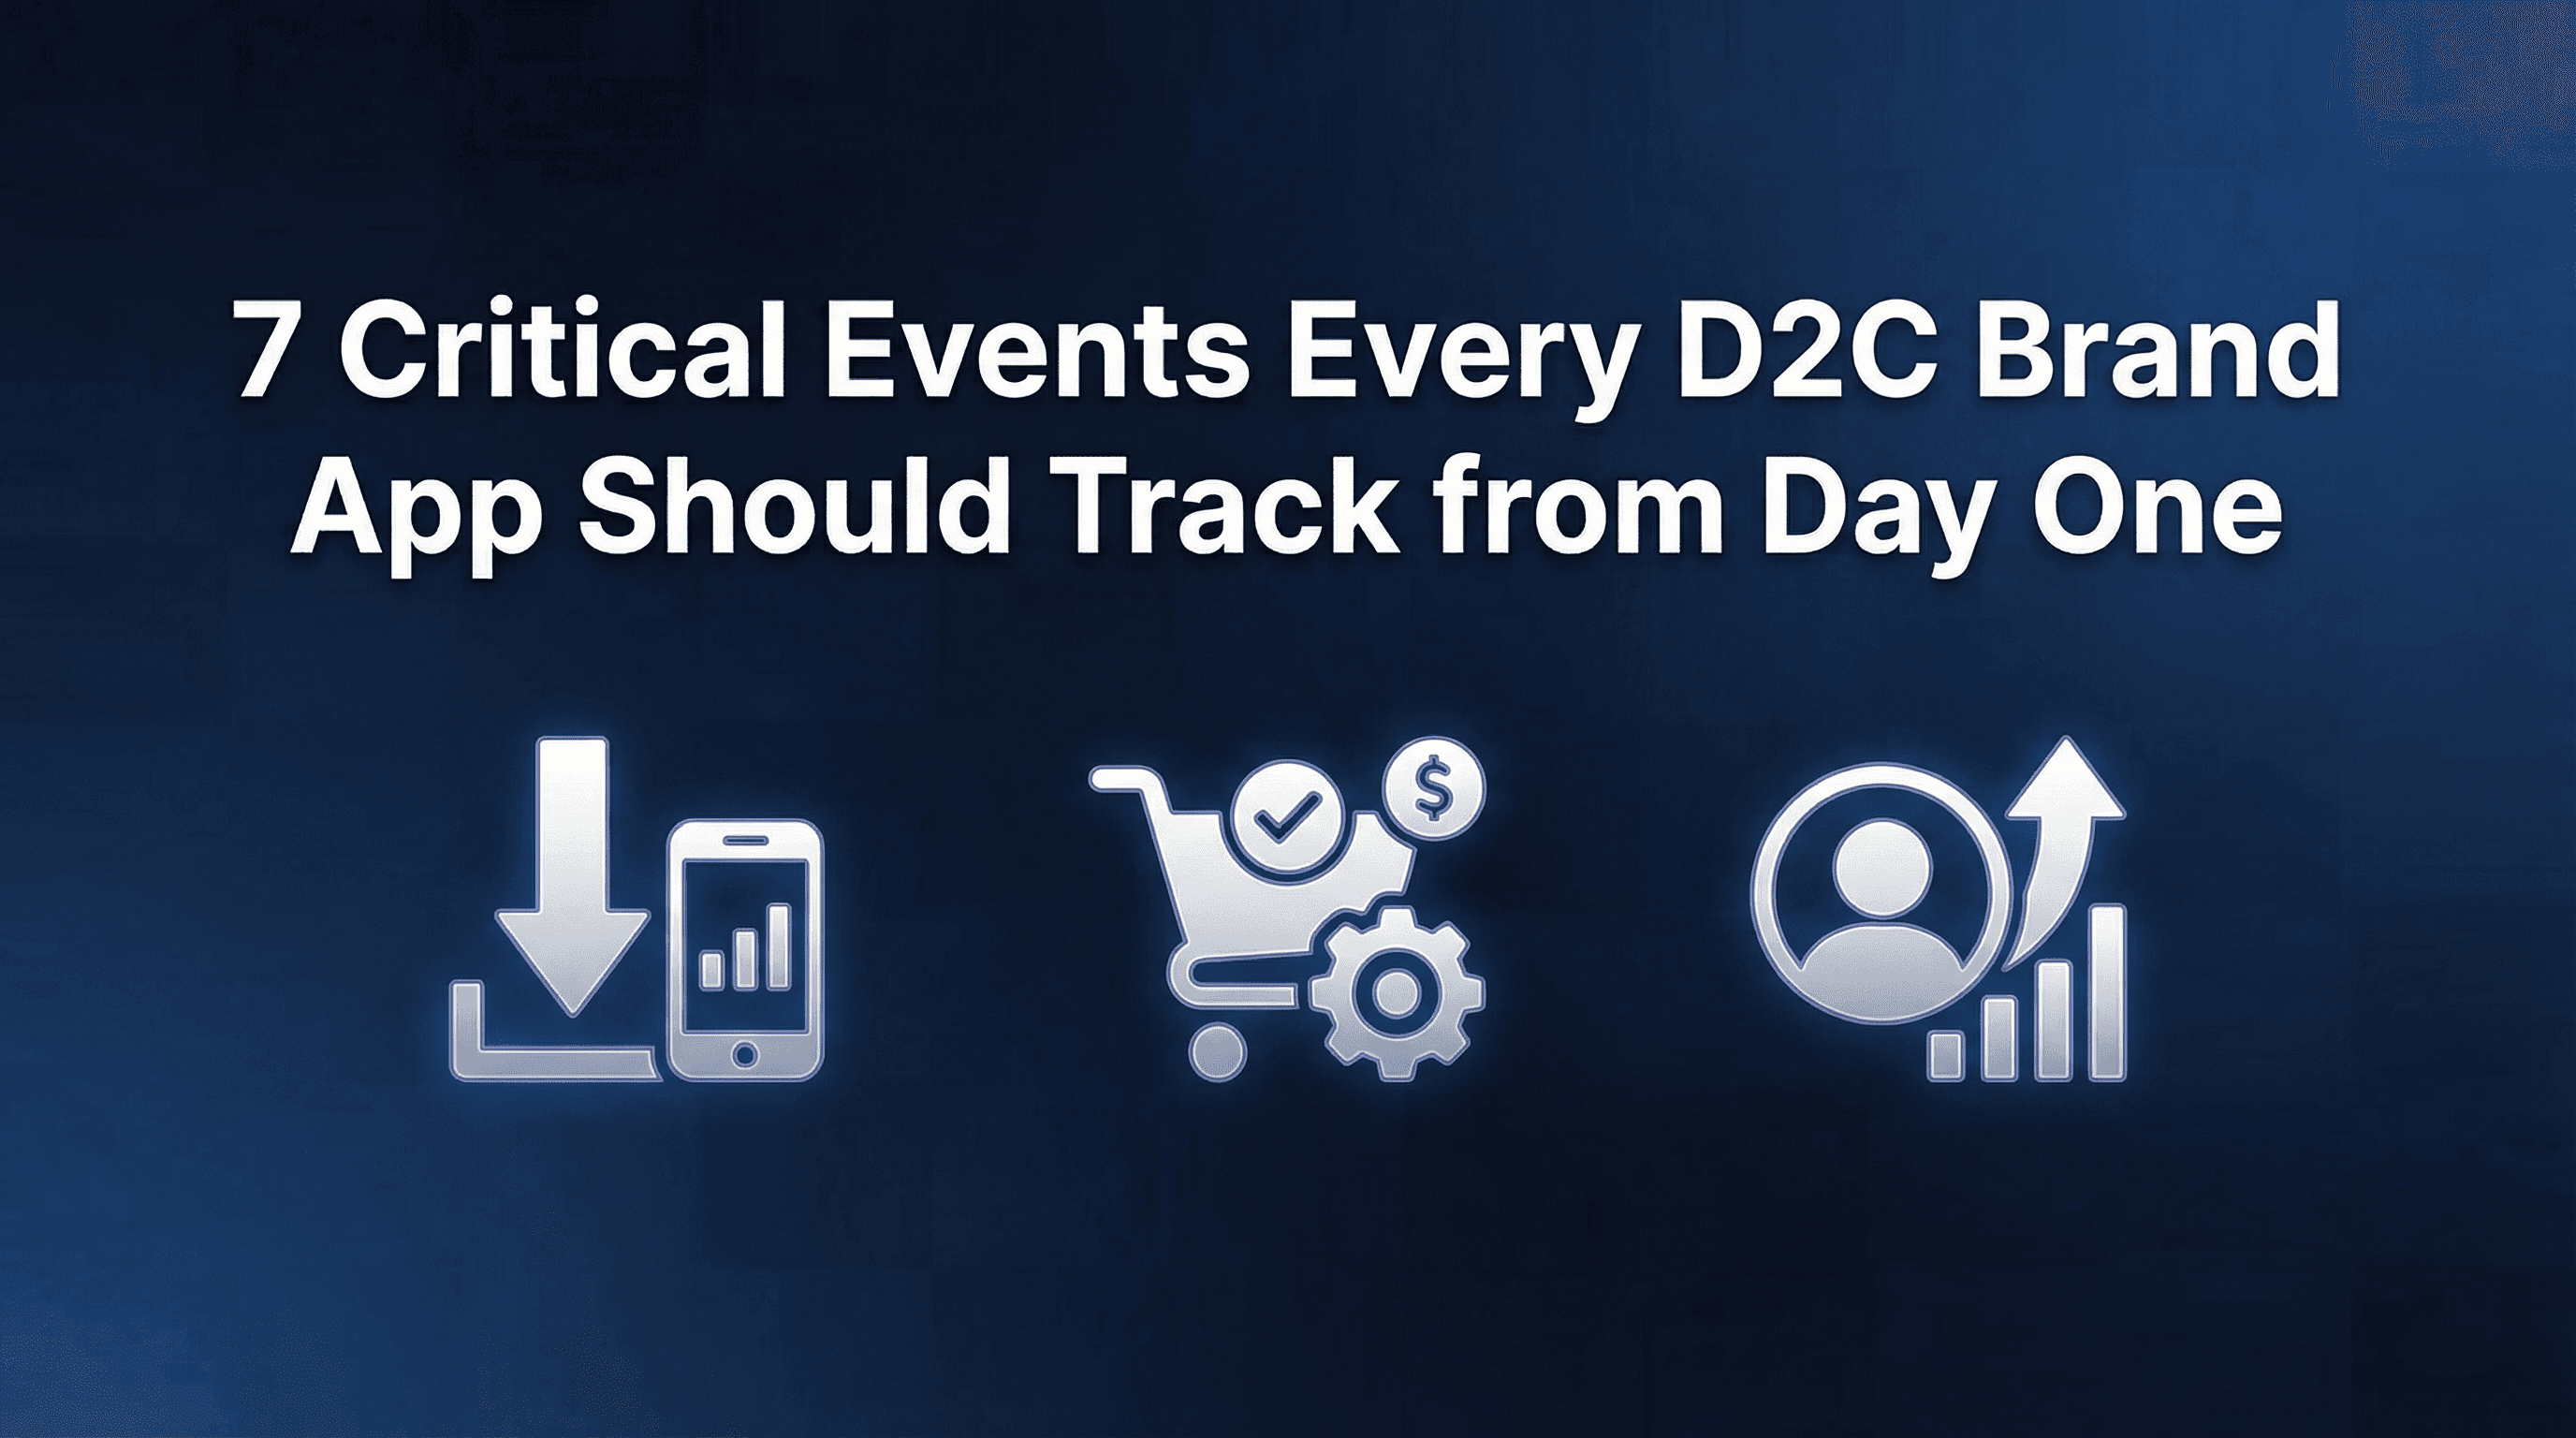
This guide breaks down the 7 events that predict purchase conversion, enable omnichannel attribution, and unlock profitable D2C growth.
Why Generic Event Tracking Fails for D2C Apps
Most D2C teams inherit event structures from marketplace eCommerce apps (Amazon-style product discovery, cart, checkout). They track product_viewed, add_to_cart, and purchase_completed, then struggle to understand why retention models don't predict repeat purchases and attribution doesn't capture the full customer journey.
The fundamental problem: D2C brand apps aren't marketplaces. Users aren't discovering your brand for the first time in the app (they already know your brand from Instagram, influencers, offline stores, or friends' recommendations). They're not comparing 50 products from different sellers. They're evaluating your specific product lineup, often influenced by offline experiences or social proof, before deciding whether to commit to your brand.
The channel fragmentation problem: D2C customers interact with your brand across multiple touchpoints before installing your app. They might see an Instagram post, visit your offline store, scan a QR code on product packaging, click a Google Search ad, watch an influencer review, then finally install your app to make a purchase. If you're only tracking the install attribution ("user came from Google"), you're missing the 3-4 prior touchpoints that actually drove awareness and consideration.
A skincare D2C brand we analysed was attributing 68% of their app purchases to Meta campaigns because Meta was driving the most installs. When they implemented proper omnichannel tracking (QR code attribution, offline store visit tracking, influencer link parameters), the picture changed dramatically: 42% of "Meta-attributed" purchases actually started with QR code scans from product packaging, and 31% followed influencer recommendations. Their budget allocation was completely backwards because they were only measuring last-click install attribution, not the full customer journey.
The loyalty ecosystem complexity: D2C brands build retention through loyalty programs, subscription models, and community engagement. A customer who accumulates 800 loyalty points and redeems them for a discount is fundamentally different from a one-time buyer who never engages with the program. Without tracking loyalty point activity, subscription activations, and referral behaviour, you can't predict LTV or identify your most valuable customer segments.
Event #1: Product Discovery (Source Attribution)
What it is: User's first meaningful product interaction in your app, tagged with the channel source that drove them there. This connects online and offline touchpoints to app activity.
Why it matters: Product discovery reveals how users found your brand and which channels drive high-intent vs casual browsers. Users arriving via QR codes from packaging convert to purchase at 6-10× higher rates than cold paid acquisition because they've already validated product quality offline.
Track this event with these parameters:
discovery_source: App launch (organic), QR code scan, deep link from web, influencer link, offline store handoff, paid ad click
product_id: Which product they viewed first
source_campaign: Specific campaign or influencer name
offline_store_id: If QR scan, which store location
time_to_discovery: Seconds from install to first product view
discovery_context: Browse, search, recommendation, category
Implementation detail: Use UTM parameters and deep link attribution to capture the complete source chain. If a user clicks an influencer's Instagram link, lands on your web product page, then installs the app and continues browsing, you need web-to-app attribution to connect those dots. Don't just track "installed from Instagram," track "installed from @influencer_name's story link about Product XYZ."
Omnichannel attribution complexity: The strongest D2C apps connect offline and online attribution. When customers scan QR codes on product packaging, you can attribute that scan to the original purchase channel (did they buy in-store, or from a previous app order?). This creates a complete loop: paid ad → web visit → first purchase → QR scan → app install → repeat purchase.
A fashion D2C brand implemented QR code tracking on their packaging with unique codes per order. They discovered that 23% of app installs came from packaging QR scans, and those users had 3.8× higher repeat purchase rates and 2.1× higher average order values compared to cold acquisition. They started calculating true customer LTV including downstream QR-driven installs, revealing that initial CAC was actually 40% lower than reported when accounting for organic reactivation.
Attribution windows: Product discovery often happens immediately post-install (within minutes) for high-intent users, or days later for exploratory installers. Track time_to_discovery to segment users: immediate discovery (under 1 hour) signals strong intent, delayed discovery (3+ days) suggests weak motivation or poor onboarding.
Event #2: AR Try-On Used (Premium Feature Engagement)
What it is: User engages with augmented reality features to virtually try on products (makeup, glasses, furniture placement, apparel sizing). This signals high consideration and purchase intent.
Why it matters: AR try-on is a premium feature that validates product fit before purchase, reducing return anxiety and increasing conversion confidence. Users who engage AR convert to purchase at 5-8× higher rates than non-AR users and have 60-70% lower return rates.
Track this event with these parameters:
product_id: What they tried on
ar_session_duration_seconds: How long they used AR
photos_captured: Did they save AR photos
share_count: Did they share AR images socially
products_tried_count: How many items they tried
conversion_within_session: Did AR lead to immediate add-to-cart
Feature adoption rate: If fewer than 8% of product viewers engage AR features, you have a discovery problem (users don't realise AR exists) or a technical problem (AR loads slowly, requires excessive permissions, produces poor results). Prominently surface AR during product browsing and onboarding.
Conversion lift measurement: Compare conversion rates for AR users vs non-AR users viewing the same products. A cosmetics brand found that users who tried lipstick shades via AR converted at 34%, compared to 6% for non-AR users viewing the same products. They made AR the default product view (not a secondary feature), increasing feature adoption from 9% to 41% and overall conversion rates by 28%.
Social amplification: Users who share AR try-on photos on social media are creating organic brand awareness while validating their purchase decision through social proof. Track share behaviour and attribute subsequent installs from those shares using deep link parameters.
AR engagement is a powerful postback event for ad platforms. Users who engage AR are showing strong purchase intent, making them ideal lookalike audiences for Meta and Google campaigns.
Event #3: First Purchase (Conversion Confirmation)
What it is: User completes payment and confirms their first order. This is your primary conversion event and validates the entire acquisition-to-purchase funnel.
Why it matters: First purchase transforms a user from prospect to customer. It validates product-market fit, pricing, checkout friction, and trust. It's also your ROAS calculation anchor and customer acquisition cost validation point.
Track this event with these parameters:
order_id: Unique transaction identifier
revenue_amount: Total order value in INR
product_ids: What they bought (multiple items if applicable)
discount_applied: Whether they used promo codes or loyalty points
payment_method: Card, UPI, wallet, COD, EMI
install_to_purchase_days: Time from install to first purchase
source_attribution: Channel that drove install
new_vs_existing: First-time app purchaser or existing customer who installed app
Critical implementation: Always validate purchases server-side before firing this event to ad networks. Client-side events are vulnerable to payment failures, fraud, and return/refund activity. Only send purchase_completed postbacks after payment confirmation and order fulfilment initiation.
Install-to-purchase window: D2C apps typically see first purchases within 1-7 days for high-intent users (those arriving via QR codes, influencer recommendations, retargeting). Cold acquisition users take 14-30 days. Configure attribution windows of at least 14 days to capture delayed conversions, and 30-45 days for comprehensive coverage.
Revenue attribution accuracy: Include both gross order value (what customer paid) and net revenue (after discounts, returns, fulfilment costs). For ROAS calculations, use net revenue to measure true business impact. A beauty brand found that campaigns optimised toward gross order value drove high transaction counts but 40% discount usage, resulting in negative contribution margins. When they optimised toward net revenue, average order values increased and profitability improved by 52%.
New vs returning customer split: Track whether this is the customer's first-ever purchase from your brand (including web, offline, other channels) or their first app purchase as an existing customer. Existing customers who install your app often have 2-3× higher LTV because they've already validated product quality through prior purchases.
Event #4: Subscription Activated (Recurring Revenue Start)
What it is: User enrolls in a subscription program (monthly product delivery, membership benefits, VIP access). This shifts the relationship from transactional to recurring revenue.
Why it matters: Subscription customers have 5-10× higher lifetime value than one-time purchasers. They provide predictable recurring revenue, higher retention rates, and better unit economics because repeat acquisition costs are eliminated.
Track this event with these parameters:
subscription_tier: Basic, premium, VIP level
billing_frequency: Monthly, quarterly, annual
subscription_value: Recurring payment amount
products_included: What they're subscribing to receive
trial_period: Free trial duration before billing
install_to_subscription_days: Time from install to subscription start
incentive_used: Discount or offer that drove subscription
Subscription vs one-time purchase split: Not all customers want subscriptions. Track what percentage of first purchases include subscription activation vs one-time orders. If subscription attachment rate is below 15%, you have either a value proposition problem (subscription benefits aren't compelling) or a positioning problem (subscriptions aren't visible during checkout).
A supplements D2C brand offered monthly subscriptions at 15% discount compared to one-time purchases. Only 8% of customers chose subscriptions initially. They repositioned subscriptions as "autoship" with flexibility to skip months, added a "never run out" benefit framing, and moved the subscription toggle higher in checkout flow. Subscription adoption increased to 34%, and 12-month customer LTV increased by 67%.
Trial-to-paid conversion: If offering free trials (7 days, 14 days, 30 days), track trial_started separately from subscription_activated. Users who activate trials but cancel before payment provide valuable product feedback and potential re-engagement targets. Trial-to-paid conversion rates of 25-40% are healthy for D2C subscriptions.
Churn prediction: Subscribers who engage frequently (view new product drops, redeem loyalty points, refer friends) churn at 3-5× lower rates than passive subscribers. Track engagement depth to identify at-risk subscribers before they cancel.
Event #5: Loyalty Points Redeemed (Program Engagement)
What it is: User redeems accumulated loyalty points for discounts, free products, or exclusive benefits. This indicates active engagement with your retention program.
Why it matters: Loyalty point redemption is one of the strongest retention predictors. Users who redeem points within 60 days of earning them have 4-6× higher 12-month retention and 2.5× higher purchase frequency compared to users who accumulate points but never redeem.
Track this event with these parameters:
points_redeemed: Amount of points used
points_remaining: Balance after redemption
reward_type: Discount, free product, exclusive access, early drop
order_value: Associated purchase amount
time_to_redemption: Days from earning to redeeming points
redemption_trigger: Expiration reminder, promotion, organic discovery
Redemption rate benchmarks: Healthy D2C loyalty programs see 30-50% of point earners redeem within 90 days. If redemption rates are below 20%, you have either a complexity problem (users don't understand how to redeem), a value problem (rewards aren't compelling), or an awareness problem (users forget about accumulated points).
Points velocity: Users who redeem points quickly (within 30 days of earning) are highly engaged. Users who accumulate points for 6+ months before redeeming are passive engagers who might churn. Track redemption velocity to segment active vs at-risk customers.
A home goods D2C app implemented redemption reminders when users hit point milestones (500 points, 1000 points, 2000 points). Redemption rates increased from 18% to 42%, and users who redeemed showed 3.8× higher repeat purchase rates over the following 6 months. They started sending points_redeemed as a high-value postback event, enabling ad platforms to optimise toward users who engaged with loyalty programs.
Redemption value optimisation: Track whether users redeem points for small discounts (under ₹200) or save them for larger rewards (₹500+). Small-value redeemers are typically more price-sensitive and transactional. Large-value savers are planning bigger purchases and often have higher average order values.
Event #6: Referral Code Shared (Viral Loop Activation)
What it is: User shares a referral code or link with friends, activating your viral acquisition loop. This indicates brand satisfaction and willingness to advocate.
Why it matters: Referral behaviour signals high customer satisfaction. Users don't refer friends to brands they're lukewarm about. Referrers have 3-5× higher LTV than non-referrers, and referred customers have 25-40% better retention than paid acquisition because they arrive with social proof validation.
Track this event with these parameters:
referral_method: WhatsApp, Instagram, SMS, email, link copy
referrer_user_id: Who shared the code
referred_user_count: How many people received the share
incentive_structure: What referrer and referee receive
share_context: Post-purchase, prompted reminder, organic
subsequent_conversions: Did shares result in installs or purchases
Viral coefficient calculation: Measure how many referral shares result in new customer acquisitions. Apps with strong product-market fit see 15-25% of shares convert to new customers. This organic acquisition multiplier compounds paid UA efforts and reduces blended CAC.
Referrer value: Customers who refer 3+ friends have 6-8× higher lifetime value than non-referrers across almost all D2C categories. They're your most engaged, satisfied customers and deserve special retention focus.
A skincare brand offered ₹500 credit for both referrer and referee on first purchase. Initial referral rates were 6% (6 out of 100 customers referred friends). They added a "gift a friend" positioning (instead of "get credit"), simplified sharing to one-tap WhatsApp, and sent referral reminders 7 days post-purchase. Referral rates increased to 23%, and referred customers showed 34% better 90-day retention than paid acquisition.
Attribution tracking: Implement referral deep links that attribute installs and purchases back to the original referrer. This creates a complete loop: referrer shares → friend installs → friend purchases → referrer receives reward. Track the full chain to measure referral program ROI.
Share timing: Users who share referral codes within 7 days of their first purchase are in the "delight window" and drive higher conversion rates. Users who share months later are often incentive-driven (prompted by point expiration or promotional campaigns) and drive lower conversion quality.
Event #7: Repeat Purchase Within 60 Days (LTV Indicator)
What it is: User completes a second purchase within 60 days of their first order. This is your primary retention validation and LTV predictor.
Why it matters: Repeat purchase rate is the single strongest indicator of product-market fit and customer retention. Users who make a second purchase within 60 days have 8-12× higher lifetime value than one-time buyers. They're validating product quality, brand trust, and overall experience.
Track this event with these parameters:
order_number: Second purchase, third purchase, etc.
revenue_amount: Transaction value
days_since_last_purchase: Time between orders
product_overlap: Did they repurchase same items or try new products
order_value_change: Percentage increase/decrease vs first order
channel_attribution: How they returned (organic, retargeting, push notification)
Repeat rate benchmarks: Healthy D2C apps see 30-45% of first-time purchasers make a second purchase within 60 days, and 50-65% within 6 months. If your 60-day repeat rate is below 25%, you have either a product quality problem (customers weren't satisfied with first purchase) or a retention marketing problem (customers forgot about your brand).
Time-to-repeat analysis: Users who repurchase within 30 days are typically in consumable categories (supplements, skincare, snacks) and show predictable repeat cadences. Users who delay 90+ days before second purchase are often in durable goods categories or showed weaker first-purchase satisfaction.
A coffee subscription D2C app found that users who made their second purchase within 21 days had an average lifetime order count of 14.3 over 18 months, compared to 3.2 orders for users whose second purchase occurred 90+ days later. They implemented targeted retention campaigns in the 14-21 day window ("time to reorder?"), increasing 30-day repeat rates from 28% to 47%.
Order value progression: Track whether repeat purchases increase, decrease, or stay flat compared to first orders. Users whose second order value is 20%+ higher than their first are showing growing brand confidence and reduced price sensitivity. Users whose orders decrease in value might be deal-seekers who only purchase during promotions.
Repurchase vs new product trial: Customers who repurchase the exact same products are validating consumable satisfaction. Customers who try new products on their second order are exploring your catalogue and have higher engagement potential. Both behaviours are positive, but they indicate different customer motivations and retention strategies.
Attribution Windows for D2C: Why Multi-Touch Matters
D2C brand apps face omnichannel attribution complexity because customers interact with brands across multiple touchpoints (offline stores, QR codes, influencers, paid ads, social media) before installing apps and making purchases.
Standard window configuration:
Install to product discovery: 24 hours (activation window)
Install to first purchase: 7-14 days (conversion window for high-intent users)
Install to first purchase: 30 days (conversion window for cold acquisition)
Install to subscription: 14-30 days (recurring revenue window)
Install to repeat purchase: 60-90 days (retention window)
The multi-touch reality: Unlike single-channel apps, D2C customers often have 3-5 touchpoints before purchase. They might see an Instagram influencer post (touchpoint 1), visit an offline store (touchpoint 2), scan a QR code on packaging (touchpoint 3), click a retargeting ad (touchpoint 4), then install and purchase (touchpoint 5).
Last-click attribution severely under-values awareness and consideration touchpoints. A jewellery brand using last-click attribution attributed 71% of app purchases to "organic installs" (users who installed without clicking ads). When they implemented proper multi-touch attribution tracking all touchpoints, they discovered that 68% of "organic" purchases actually followed Instagram influencer exposure 14-30 days prior. Their influencer ROI was 4.2× higher than reported because last-click attribution missed the awareness driver.
QR code attribution: When customers scan QR codes from product packaging, that scan should be attributed back to the channel that drove the original purchase. If a customer bought via a Meta ad, received the product with QR code, scanned the code, installed the app, and made a repeat purchase, the full chain connects to the original Meta campaign. Most attribution systems break this chain, under-attributing the long-term value of initial acquisition campaigns.
Common Implementation Mistakes to Avoid
Most D2C teams make predictable errors when implementing event tracking. Here's what to watch out for:
Missing QR code attribution: QR codes on packaging are powerful reactivation tools, but only if properly tracked. Use unique QR codes with deep link parameters that connect to original purchase attribution.
Ignoring offline touchpoints: Customers who visit physical stores before installing apps follow different purchase patterns. Implement store visit tracking or offline-to-online attribution to capture the full journey.
Treating all purchases equally: A ₹500 impulse purchase is fundamentally different from a ₹5,000 considered purchase or a ₹2,000/month subscription. Track transaction types and values separately to understand customer segments.
Not tracking returns and refunds: D2C apps, especially in apparel and cosmetics, face 15-30% return rates. Track order_returned and refund_processed events to maintain accurate revenue attribution and identify quality issues.
Missing loyalty program data: Simply tracking "points earned" without redemption behaviour prevents you from understanding program engagement. Track both accumulation and redemption to measure true program value.
Forgetting influencer attribution: Influencer-driven installs often occur days or weeks after content exposure. Use extended attribution windows (30 days minimum) and UTM parameters in influencer links to capture delayed conversions.
How Linkrunner Enables Omnichannel D2C Attribution
D2C brand apps need attribution platforms that connect online and offline touchpoints, track loyalty programs, and measure true customer lifetime value across subscription and repeat purchase behaviour. Platforms like Linkrunner simplify omnichannel complexity while providing the measurement depth D2C teams require.
Linkrunner's deep linking and attribution infrastructure makes it simple to track QR code scans, influencer referrals, and web-to-app journeys with unique parameters for each source. Instead of treating all installs as identical, you can see exactly which channels drive AR feature engagement, subscription activations, and repeat purchases.
The platform's campaign intelligence dashboard shows full-funnel visibility across all acquisition channels with revenue tracking at the cohort level. You can compare Meta campaigns, Google Search ads, influencer partnerships, and QR code scans side-by-side to understand which channels drive the highest LTV customers.
For teams managing loyalty programs and subscription models, Linkrunner's event tracking makes it simple to identify which acquisition channels drive customers who engage loyalty points and activate subscriptions, not just customers who make one-time purchases.
At ₹0.80 per attributed install, Linkrunner costs 3-10× less than legacy MMPs while providing the omnichannel attribution accuracy and LTV tracking that D2C brands need to scale profitably.
If you're spending 5-10% of your UA budget on attribution tooling while missing key touchpoints in your customer journey, request a demo from Linkrunner to see how modern MMPs deliver better omnichannel measurement at a fraction of the cost.
Key Takeaways
D2C brand apps require specialised event tracking that captures omnichannel journeys and measures true customer lifetime value:
Track product_discovery with source attribution to connect offline stores, QR codes, and influencer referrals to app activity
Measure ar_try_on engagement as a powerful conversion predictor (5-8× higher purchase rates)
Validate first_purchase server-side and include source attribution to understand which channels drive paying customers
Monitor subscription_activated separately from one-time purchases (5-10× higher LTV)
Track loyalty_points_redeemed as a retention predictor (redeemers have 4-6× better retention)
Measure referral_code_shared to quantify viral loops and identify brand advocates
Capture repeat_purchase within 60 days as your primary LTV indicator (8-12× higher lifetime value)
Implement multi-touch attribution to credit awareness touchpoints (influencers, offline stores) that drive delayed app conversions
Implementation takes one week if you prioritise omnichannel tracking and QR code attribution before scaling spend. Most D2C teams waste months with last-click attribution that misses 50-70% of the customer journey.
The teams winning in D2C are those who measure the complete journey from first brand exposure through repeat purchases, connecting online and offline touchpoints to understand true customer acquisition costs and lifetime value. Everything else is noise.