Your Meta Ads dashboard shows 4.2x ROAS on yesterday's campaigns. Your MMP dashboard shows 2.8x ROAS for the same campaigns on the same day. Both systems are tracking the same installs and the same revenue events. The numbers should match. They don't.
You check the data three times. Meta counted 847 conversions. Your MMP counted 612. The revenue totals are different. The attribution windows show different settings. Now you're in a Monday morning meeting and your CFO asks which number to trust for budget decisions.
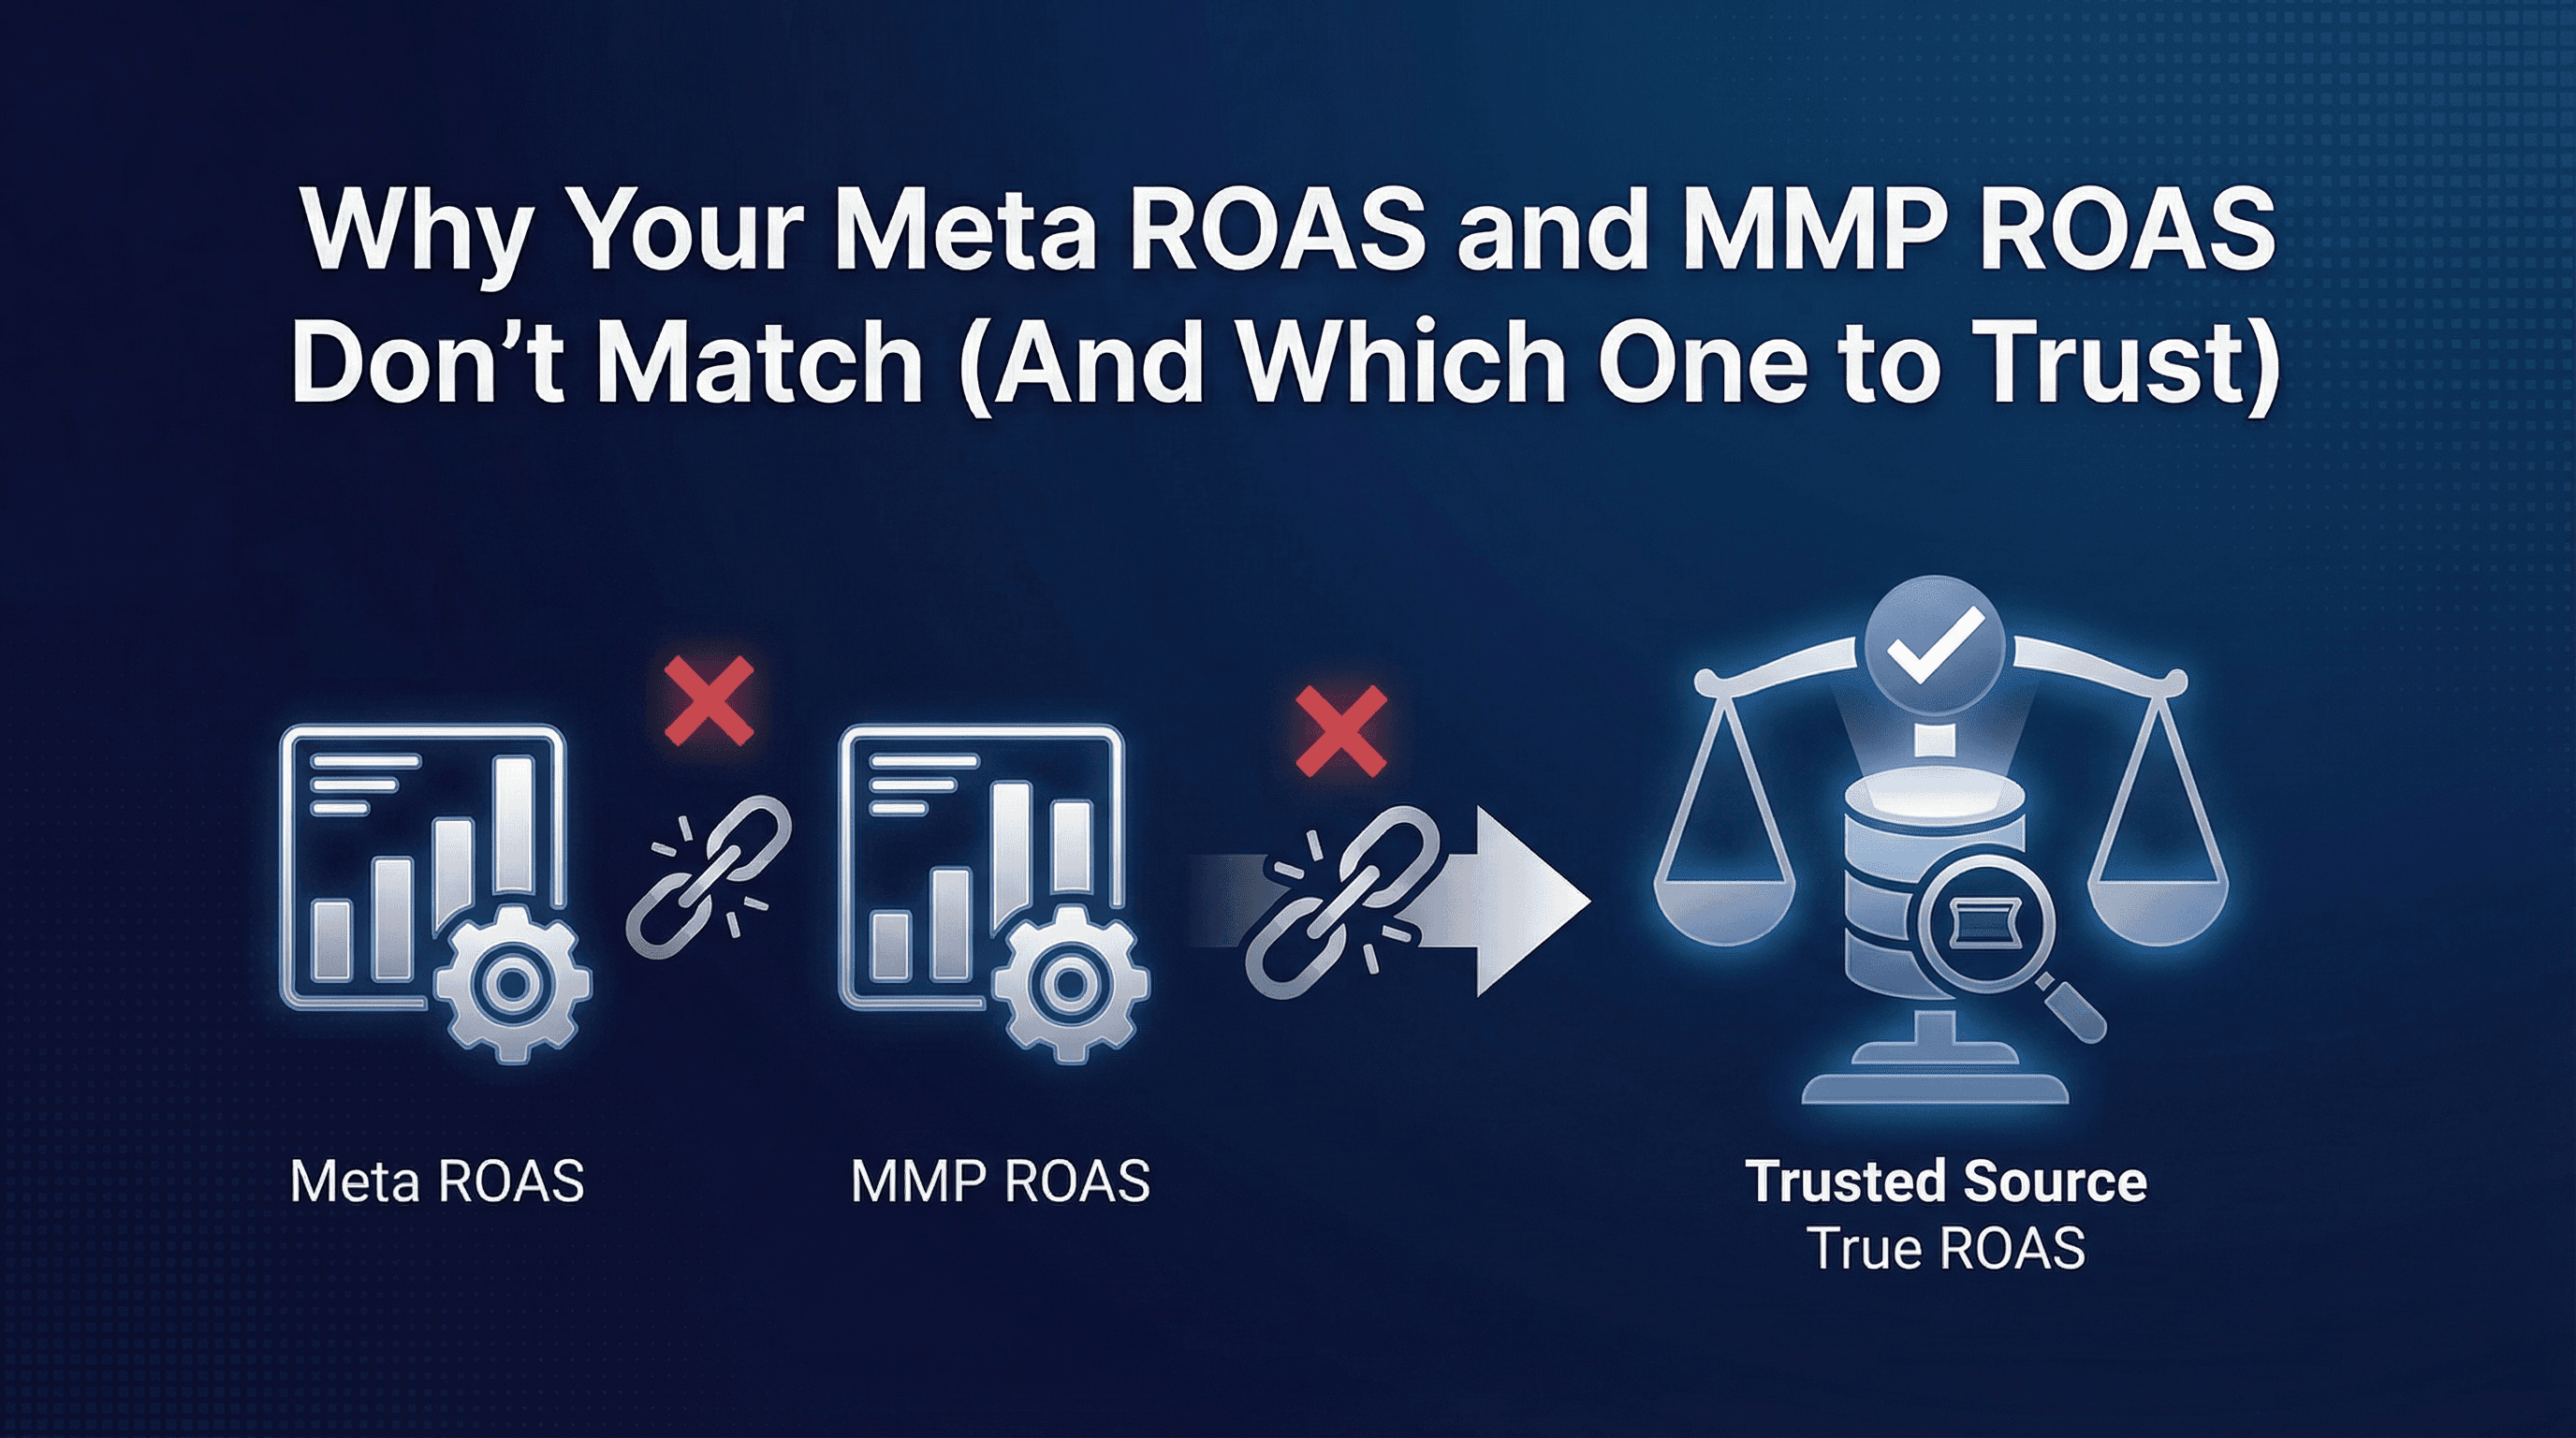
This isn't a data quality problem. It's a measurement philosophy problem. Meta and MMPs measure user journeys differently, count conversions using different rules, and optimise toward different objectives. Understanding why the discrepancy exists and which metric to trust for specific decisions is what separates effective performance marketers from teams drowning in reconciliation spreadsheets.
The ROAS Mismatch Problem (When Dashboards Tell Different Stories)
The ROAS discrepancy shows up in three common scenarios.
Scenario one: your Meta dashboard reports strong performance (3.5-5x ROAS) while your MMP shows concerning economics (1.8-2.5x ROAS). You're unsure whether to scale spend or pull back.
Scenario two: both platforms show positive ROAS but disagree on magnitude. Meta says your top campaign delivers 6x ROAS. Your MMP says the same campaign delivers 3.2x. Budget allocation decisions hinge on knowing which campaign actually performs better.
Scenario three: the platforms disagree on trend direction. Meta shows ROAS improving week over week. Your MMP shows ROAS declining. You can't optimise when you don't know if performance is getting better or worse.
Most teams respond by building reconciliation spreadsheets, running dual reporting systems, or picking one dashboard and ignoring the other. None of these solve the underlying problem: you're comparing metrics that measure fundamentally different things.
Why Meta and MMP ROAS Will Always Differ (Fundamental Measurement Approaches)
Meta optimises its algorithm using its own measurement. MMPs provide independent verification of business outcomes. These serve different purposes.
Meta's measurement exists to train the ad algorithm. The platform needs fast feedback loops, probabilistic modeling to fill attribution gaps, and view-through credit to understand the full impact of ad exposure. Meta's ROAS metric tells you how the algorithm perceives campaign performance.
Your MMP measures actual business economics. It tracks deterministic click-to-install journeys, applies consistent attribution rules across all channels, and connects ad spend to real revenue. MMP ROAS tells you which campaigns actually drove profitable user acquisition.
Both metrics have value. But they answer different questions. Meta ROAS answers: "How is the algorithm learning?" MMP ROAS answers: "Which campaigns made money?"
Expecting perfect alignment between these metrics is like expecting your speedometer and your GPS to show identical numbers. They measure related but distinct things.
The 7 Core Causes of ROAS Discrepancy
Cause #1: Attribution Window Differences (1-day click vs 7-day click)
Attribution windows define how long after someone clicks an ad you'll credit that ad with conversions.
Meta's default attribution window for conversions is 7-day click and 1-day view. If someone clicks your ad on Monday, installs on Wednesday, and makes a purchase on Friday, Meta attributes that purchase to Monday's ad (within the 7-day click window).
Most MMPs use tighter windows. A typical MMP setup uses 24-hour click attribution for installs and 7-day post-install windows for revenue events. The same user journey (click Monday, install Wednesday, purchase Friday) might get attributed differently.
Here's where the discrepancy grows: Meta counts conversions within 7 days of click. Your MMP counts installs within 24 hours of click, then tracks revenue for 7 days after install. If the user delays installation by 48 hours, Meta still attributes the journey but your MMP doesn't.
The fix: align attribution windows across platforms or understand which window matches your business reality. For high-intent products (food delivery, mobility), 24-hour click windows make sense. For considered purchases (travel, big-ticket eCommerce), 7-day windows capture more of the actual customer journey.
Cause #2: View-Through Attribution (Meta Counts Views, MMPs Often Don't)
View-through attribution credits conversions to users who saw your ad but didn't click.
Meta includes 1-day view-through attribution by default. If someone sees your ad on Instagram, doesn't click, then installs your app later that day through an App Store search, Meta attributes that install to the ad impression.
Most MMPs don't track view-through conversions for mobile apps. They measure click-based attribution only. Same user journey, different attribution outcome.
View-through attribution inflates Meta's numbers, sometimes significantly. For campaigns with high impression volume and low click-through rates (brand awareness creative, broad targeting), view-through conversions can represent 20-40% of Meta's total attributed conversions.
The question isn't whether view-through attribution is real. It's whether you should optimise toward it. View-through conversions measure ad exposure impact but don't prove causal relationships as strongly as click-based attribution.
Cause #3: Conversion Event Mapping Misalignment
Meta and your MMP might count different events as conversions.
Meta optimises toward whatever conversion event you select in the campaign: app installs, registrations, purchases, or custom events. If you're optimising for "add to cart" events, Meta's ROAS calculation uses add-to-cart as the conversion.
Your MMP typically calculates ROAS using purchase revenue only. If Meta is optimising toward registrations (a top-of-funnel event) and your MMP measures purchase revenue (bottom of funnel), the metrics measure completely different user actions.
Common mapping issues:
Revenue value discrepancies: Meta receives revenue postbacks in USD but your MMP tracks INR. Currency conversion timing differences create 2-5% variance.
Event deduplication: A user might trigger the same purchase event twice (network retry, app crash during confirmation). Meta might count both. Your MMP deduplicates.
Test events in production: Development teams testing purchase flows accidentally fire real conversion events. These pollute Meta's data but get filtered from MMP reports.
Understanding Mobile Attribution for App Growth covers event mapping fundamentals that prevent these misalignments.
Cause #4: Currency and Timezone Handling
Timezone and currency settings create subtle but persistent discrepancies.
Meta reports data in your account's configured timezone. If your account is set to PST but your business operates in IST, revenue from late-night purchases (11 PM IST = 9:30 AM PST) gets attributed to the wrong calendar day in Meta.
Your MMP typically uses UTC or your app's configured timezone. Same purchase, different day, different ROAS calculation when you compare daily performance.
Currency conversion introduces another layer. Meta receives purchase revenue in the currency your app sends. If you send USD values but your actual revenue is in INR, the conversion rate Meta uses (cached, updated daily) might differ from your actual bank settlement rate.
A 2-3% variance from currency and timezone issues compounds over weeks. By month-end, the discrepancy looks like a measurement problem when it's actually a configuration mismatch.
Cause #5: Statistical Modelling vs Deterministic Tracking
Meta uses statistical modeling to estimate conversions it can't measure deterministically.
Post-iOS 14.5, Meta can't track individual user journeys for users who denied ATT permission. Instead, Meta uses statistical models, aggregate data, and probabilistic attribution to estimate what happened. If 100 users saw your ad, 30 clicked, and SKAdNetwork reports 12 aggregate conversions, Meta's model estimates which of those 30 clicks drove the 12 conversions.
Your MMP tracks deterministic data where possible (click IDs, device fingerprints, SKAdNetwork postbacks) and reports what it can actually measure. When attribution isn't possible, the MMP reports it as organic or unattributed, not as a modeled estimate.
Meta's modeled numbers trend higher because the platform fills attribution gaps with estimates. Your MMP's numbers trend lower because it only reports what it can verify.
Neither approach is wrong. They serve different purposes. Meta's modeling helps the algorithm optimise even with incomplete data. Your MMP's deterministic approach gives you conservative, verifiable economics.
Cause #6: Data Freshness and Lag (Real-time vs Daily Sync)
Meta reports data in near real-time. Your MMP syncs data on different schedules.
Meta's dashboard updates continuously. Install events appear within minutes. Purchase events post within hours. When you check ROAS at 10 AM, you're seeing near-complete data for yesterday plus partial data for today.
Your MMP receives data through multiple paths: SDK events post within minutes, but SKAdNetwork postbacks arrive 24-72 hours after conversion. Revenue events sync from your backend systems on whatever schedule you configured (hourly, daily, or real-time depending on your setup).
If you compare Meta's ROAS for "yesterday" against your MMP's ROAS for "yesterday" at 10 AM this morning, you're comparing complete Meta data against incomplete MMP data. The MMP is still waiting for delayed SKAdNetwork postbacks and overnight revenue syncs.
The fix: compare data 48-72 hours after the date you're analyzing. By Thursday, both Meta and your MMP have complete data for Monday.
Cause #7: Revenue Duplication in Multi-Touch Scenarios
When users interact with multiple ads before converting, attribution rules determine which ad gets credit.
Meta uses last-touch attribution within its own platform. If a user clicks three different Meta ads (Monday, Wednesday, Friday) then purchases Saturday, Meta attributes the purchase to Friday's ad.
Your MMP might use different attribution logic. If you're running a multi-touch attribution model, the MMP might split credit across all three touchpoints. If you're using first-touch attribution, the MMP credits Monday's ad. If you're using last-touch cross-channel attribution, the MMP might attribute to a Google ad the user clicked on Friday evening, not Meta at all.
Same purchase, different attribution logic, completely different ROAS calculations for each campaign.
Best 6 Attribution Models for Different Mobile App Verticals explains when to use each attribution approach and how model choice affects reporting.
Diagnostic Framework: Which Discrepancy Applies to You
Before fixing the discrepancy, diagnose which causes apply to your setup.
Step 1: Check attribution window settings
Log into Meta Ads Manager, open any campaign, check the attribution setting. Compare against your MMP's attribution window configuration. If Meta uses 7-day click and your MMP uses 1-day click, you've found cause #1.
Step 2: Verify view-through attribution
In Meta, check whether view-through conversions are enabled (they are by default). In your MMP, check whether view-through tracking is configured (it usually isn't for mobile apps). If Meta counts views and your MMP doesn't, you've found cause #2.
Step 3: Audit conversion event mapping
Confirm that Meta and your MMP are measuring the same events. Check Meta's conversion tracking configuration against your MMP's postback setup. Verify revenue values match (same currency, same amounts, same events).
Step 4: Review timezone and currency settings
Document the timezone configured in Meta versus your MMP. Check currency settings in both platforms. Look for late-night purchases that might shift between calendar days.
Step 5: Quantify the gap
Calculate the percentage difference. If Meta shows 4.2x ROAS and MMP shows 2.8x, the gap is 50%. Now map each identified cause to an estimated impact. Attribution window differences might explain 25%, view-through another 15%, data lag another 10%.
Step 6: Test with a controlled scenario
Launch a new campaign with aligned settings: 1-day click attribution in both platforms, same conversion events, same currency, same timezone. Compare ROAS after 7 days. The remaining discrepancy reveals how much comes from modeling differences versus configuration gaps.
Reconciliation Strategies for Each Discrepancy Type
For attribution window mismatches:
Align both platforms to the same window. If your business has short consideration cycles (food delivery, mobility), use 1-day click in both Meta and MMP. If you have longer cycles (travel, high-ticket eCommerce), use 7-day click in both platforms.
For view-through attribution differences:
Disable view-through in Meta if you want conservative, click-only measurement. Or enable view-through tracking in your MMP if the platform supports it and you want credit for impression-based conversions.
For conversion event mapping issues:
Standardize event names, currency codes, and revenue values across platforms. Create a conversion event mapping document that shows exactly which Meta event corresponds to which MMP event. Audit postback configurations quarterly.
For timezone and currency problems:
Set both platforms to the same timezone (typically UTC or your primary business timezone). Use the same currency throughout (typically USD for international businesses or INR for India-focused apps). Build reports that account for any unavoidable timezone differences.
For modeling vs deterministic tracking gaps:
Accept that these platforms measure differently. Meta's modeled estimates will trend higher. Your MMP's deterministic tracking will trend lower. Use Meta data for optimization signals and MMP data for financial planning.
For data lag issues:
Wait 48-72 hours before comparing performance across platforms. Build daily dashboards using Meta's real-time data. Build weekly performance reviews using MMP data that's had time to fully sync.
For multi-touch attribution discrepancies:
Choose one attribution model and apply it consistently. If you're using last-touch attribution in your MMP, configure Meta campaigns to optimise using Meta's last-touch data. If you're using multi-touch attribution, understand that Meta will always show higher ROAS (it only sees its own touchpoints).
Which ROAS to Trust for Optimization Decisions
The answer depends on what you're trying to optimise.
When to Optimize Toward Meta ROAS (Platform Feedback Loop)
Use Meta ROAS for real-time campaign optimization decisions: bid adjustments, budget reallocation between campaigns, creative testing, and audience expansion.
Meta's algorithm optimises using Meta's data. When you increase budget on a campaign showing 4.5x ROAS in Meta, the algorithm interprets that as positive signal and finds more users matching that pattern. Fighting the algorithm by using external data sources slows learning.
Practical application: check Meta ROAS daily to make tactical decisions. Pause campaigns below 2x ROAS in Meta. Scale campaigns above 4x ROAS in Meta. Test new creatives and measure performance using Meta's attribution.
Meta ROAS tells you how to work with the platform's algorithm, not whether the campaign is profitable for your business.
When to Optimize Toward MMP ROAS (True Business Economics)
Use MMP ROAS for financial planning, budget allocation across channels, and strategic decision-making.
Your MMP provides cross-channel attribution, consistent measurement methodology, and verifiable business outcomes. When your CFO asks "Which channels should we fund next quarter?", answer using MMP data.
Practical application: review MMP ROAS weekly to validate Meta's performance claims. If Meta shows 5x ROAS but your MMP shows 2.5x, investigate the gap. Use MMP data to compare Meta against Google, TikTok, and other channels on equal footing.
MMP ROAS tells you which campaigns actually made money and where to allocate budget strategically.
How to Measure True Marketing ROI in Mobile Apps provides frameworks for measuring profitability across all channels.
The Hybrid Approach: Using Both Metrics Strategically
The best performance marketers use both dashboards strategically, not interchangeably.
Daily optimization: Use Meta ROAS to make fast decisions. Pause underperforming campaigns, scale winners, test creative concepts. The algorithm needs fast feedback loops and responds to its own measurement.
Weekly validation: Compare Meta ROAS to MMP ROAS at campaign level. If a campaign shows 6x in Meta but 2x in your MMP, investigate why. Maybe the campaign drives low-quality users who install but don't convert. Maybe there's a technical issue with revenue tracking. The discrepancy reveals insights.
Monthly strategic planning: Use MMP ROAS for budget decisions. Allocate next month's spend based on verified channel performance from your MMP, not Meta's optimistic estimates.
Quarterly business reviews: Report to leadership using MMP data. CFOs and boards trust independent verification more than platform-reported numbers.
This hybrid approach lets you optimise fast (Meta data) while staying grounded in business reality (MMP data).
Implementation Playbook: ROAS Reconciliation Workflow
Week 1: Audit current state
Document attribution windows, conversion events, timezones, and currency settings in both Meta and your MMP. Calculate current ROAS discrepancy percentage. List all configuration differences.
Week 2: Align settings where possible
Standardize attribution windows across platforms. Fix timezone and currency mismatches. Verify conversion event mapping. Update postback configurations if needed.
Week 3: Run parallel measurement
Launch a test campaign with fully aligned settings. Track performance in both Meta and MMP for 14 days. Measure remaining discrepancy.
Week 4: Document reconciliation process
Create a standard operating procedure: how to compare ROAS across platforms, which metric to use for which decisions, how to explain discrepancies to leadership.
Ongoing: Weekly reconciliation checks
Every Monday, compare Meta ROAS to MMP ROAS for your top 5 campaigns. Investigate any campaign where the gap exceeds expected variance. Use the diagnostic framework to find root causes.
Platforms like Linkrunner simplify this reconciliation by providing unified dashboards that show both platform-reported data and independently verified attribution, making discrepancies visible immediately rather than hidden across separate systems.
FAQ: ROAS Discrepancy Questions Answered
How much discrepancy is normal?
10-25% variance is typical when comparing Meta ROAS to MMP ROAS, driven primarily by attribution window differences and view-through attribution. Gaps exceeding 40% suggest configuration issues or measurement problems that need investigation.
Should I disable view-through attribution in Meta?
If you want conservative measurement aligned with your MMP, yes. If you want Meta's algorithm to optimise using all available signals, keep view-through enabled but understand it inflates Meta's reported ROAS compared to MMP.
What if Meta ROAS is lower than MMP ROAS?
This is unusual but possible. Common causes: your MMP is attributing organic installs to Meta incorrectly, Meta's statistical modeling is underestimating iOS conversions, or revenue events are reaching your MMP but not posting back to Meta properly. Audit postback configuration.
Can I fix the discrepancy completely?
No. Meta and MMPs measure fundamentally different things using different methodologies. You can reduce discrepancy through configuration alignment, but 10-20% variance will persist due to modeling differences and platform-specific attribution logic.
Which platform reports more accurate ROAS?
Neither is "more accurate." They measure different things. Meta optimises its algorithm using its own measurement. Your MMP verifies business outcomes using independent tracking. Use both strategically rather than treating one as truth.
Key Takeaways
Meta ROAS and MMP ROAS differ because the platforms measure user journeys using different attribution windows, conversion counting rules, and modeling approaches. The discrepancy is structural, not a data quality problem.
The seven core causes are attribution window differences (1-day vs 7-day), view-through attribution (Meta counts views, MMPs typically don't), conversion event mapping misalignment, currency and timezone handling, statistical modeling versus deterministic tracking, data freshness lag, and multi-touch attribution logic differences.
Use Meta ROAS for daily optimization decisions. The algorithm learns from its own measurement, so Meta data drives faster iteration and better campaign performance within the platform.
Use MMP ROAS for financial planning and strategic budget allocation. Your MMP provides cross-channel attribution and verifiable business economics that leadership can trust.
Reconcile the metrics weekly by comparing performance at campaign level and investigating large discrepancies. Document which causes apply to your setup and align settings where possible. Accept that 10-20% variance will persist due to fundamental measurement differences.
The best approach is hybrid: optimise daily using Meta's real-time data, validate weekly against MMP verification, and plan strategically using MMP's cross-channel attribution. Both metrics have value when used for their intended purposes.